Check the CRON Expression
After published your live dashboard, you maybe want to check if the CRON expression generated was what you expected.
For this, let’s open Data Integration Tool
Show me how
Check the CRON Expression
Open Data Integration Tool by double clicking on its icon on the Windows task bar.
The first time you open it, there is nothing on the screen except the warning sign shown in the screen above. Click refresh.
Then, the [Code192] Process Group appears, double click on it or right click on it and click enter group button, the next group appears, do the same.
Now, your DataFlow appears, right click on the RequestWebDataToSQL Process group like below click on View Configuration, and the processor details windows appears.
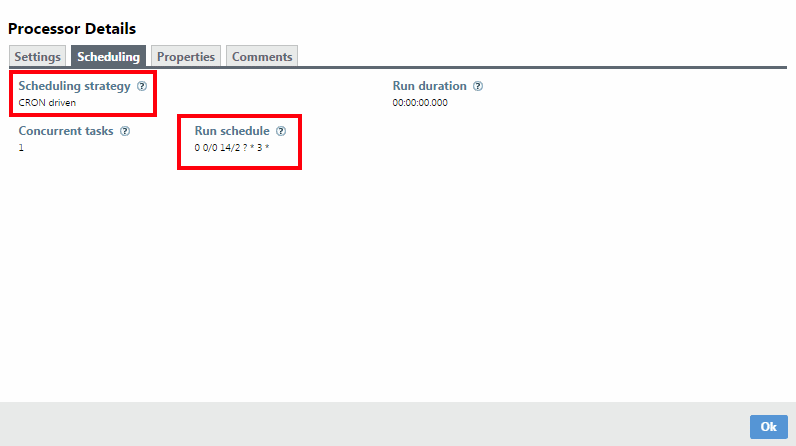
Click on the Scheduling tab and check the CRON Expression like below.
Finally, you can see the Scheduling strategy value is CRON Driven. And your CRON expression is under the Run Schedule information like below.
Our previous example was:
We want to update our dashboard each tuesday every 2 hours from 14H (2pm).
Now we can check if it’s correct below.