Finding error logs
Alpana Server error logs
- Server common errors (Server UI features, API) :
C:\code192\Alpana Server\Server.Web\App_Data\Logs\
- Dashboard preview page common base errors (Handled exceptions) :
C:\code192\Alpana Platform\Alpana Server\(version number)\ErrorLogs\
- Dashboard preview page common error (Unhandled Service exceptions) :
C:\code192\Alpana Server\Server.Web\DashboardService\TracingLog\
Alpana Designer error logs
- Designer errors :
%localappdata%\code192\Alpana Designer\(version number)\ErrorLogs\
- Dashboard preview common base errors (Handled exceptions) :
%localappdata%\code192\Alpana Platform\Alpana Designer\(version number)\ErrorLogs\
- Dashboard preview common errors (Unhandled Service exceptions) :
%ProgramData%\code192\Alpana Platform\Alpana Designer\(version number)\IISExpress_DashboardService\TracingLog\
Troubleshooting Errors
The below troubleshooting steps will help to resolve the respective issues.
DV001
| CODE |
DV001 |
| TEXT |
Unable to load the Dashboard since it was created in a higher version of Alpana Designer (Version: X.X.X.X) |
| DESCRIPTION |
The dashboard should have been created in a higher version of Alpana Designer (For example, v2.0.6.2) than that of dashboard service through which it is currently running (For example, v2.0.5.7). |
| SOLUTION |
Ensure the version of Alpana Designer and that of the deployed Alpana Server are same.
If the dashboard file belonged to the version higher than that of the targeted deployment environment, recreate the dashboard through the respective versioned Alpana Designer.
|
DV002
| CODE |
DV002 |
| TEXT |
The Dashboard Service could not be contacted. There may be a temporary glitch or the server may be down. |
| DESCRIPTION |
Dashboard Service is not reachable either due to connection failure or long awaited response or it is being used by some other process. |
| SOLUTION |
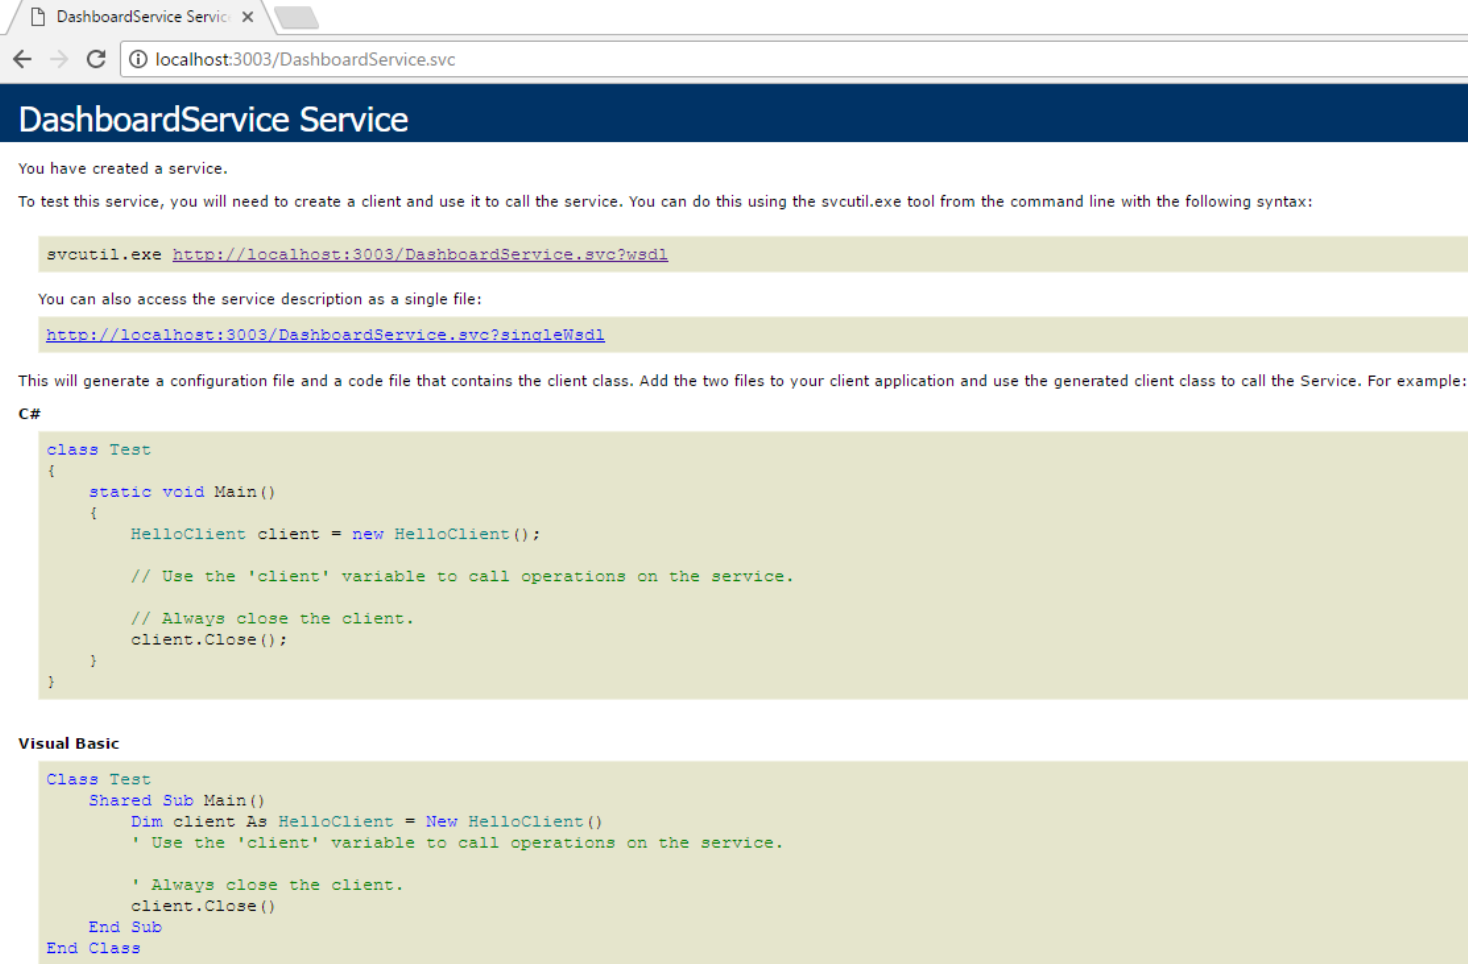
Make sure that the Dashboard Service is running in the machine where the dashboard exists. You can test the service URL in the browser of the respective machine whose format will look like below.
http://domain:port/DashboardService/DashboardService.svc (or) https://domain:port/DashboardService/DashboardService.svc
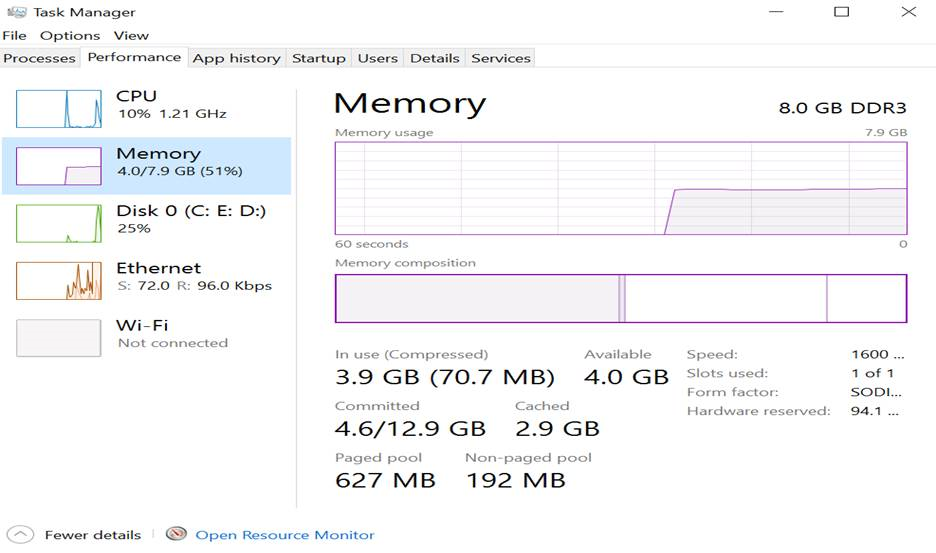
Check System Memory usage and make sure, it has at least a minimum of 5% free space for use.
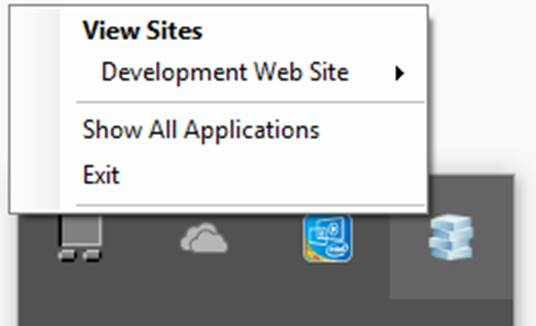
Restart the IIS or IIS Express where the dashboard service is hosted.
In case of previewing from Alpana Designer, stop the IIS Express and click `Preview` in Designer Toolbar to preview the dashboard.
|
DV003
| CODE |
DV003 |
| TEXT |
Dashboard could not be rendered since the service URL is not set. |
| DESCRIPTION |
Dashboard will not render when either the service URL is not set or the given URL is incorrect. |
| SOLUTION |
This is an internal issue. Please check with code192 Support through your distributor.
|
DV004
| CODE |
DV004 |
| TEXT |
Dashboard could not be rendered since the dashboard path is not set. |
| DESCRIPTION |
Dashboard will not render when either the Dashboard path is not set or the given path is incorrect. |
| SOLUTION |
This is an internal issue. Please check with code192 Support through your distributor.
|
DV005
DV006
| CODE |
DV006 |
| TEXT |
The requested dashboard file was not found. It may be either moved or renamed. |
| DESCRIPTION |
The loaded dashboard file may either be not available in the specified path or the file name is incorrect or the loaded file itself is invalid. |
| SOLUTION |
Ensure the dashboard file is available in the specified dashboard path.
Ensure the name of the dashboard file specified is appropriate.
Ensure the loaded file has valid file extension (*.SYDX).
|
DV007
| CODE |
DV007 |
| TEXT |
The requested file or assembly was not found. It may be either moved or renamed. |
| DESCRIPTION |
Any of the assembly related to Dashboard Service is missing at installation location. |
| SOLUTION |
If you are previewing dashboard from Dashboard Designer, check whether any assembly is missing in the installed location (%ProgramData%\code192\Alpana Platform\Alpana Designer\(version number)\IISExpress_DashboardService\bin\) or reinstall the Alpana Designer application.
If you are loading dashboard from Alpana Server, check whether any assembly is missing in the installed location (C:\code192\Alpana Server\Server.Web\DashboardService\bin\) or reinstall the Alpana Server application.
List of assemblies in the installed location
Dashboard.Core.Configuration.dll
Dashboard.Core.dll
Dashboard.Core.JsonRepository.dll
Dashboard.HTML.dll
Dashboard.ServerFacade.dll
Dashboard.Service.dll
Dashboard.ServiceFacade.dll
EntityFramework.dll
EntityFramework.SqlServer.dll
KBCsv.dll
KBCsv.Extensions.Data.dll
KBCsv.Extensions.dll
Newtonsoft.Json.dll
Syncfusion.Compression.Base.dll
Syncfusion.DashboardDesigner.Security.dll
Syncfusion.Server.Base.Encryption.dll
Syncfusion.XlsIO.Base.dll
System.Data.SQLite.dll
System.Data.SQLite.EF6.dll
System.Data.SQLite.Linq.dll
|
DV008
| CODE |
DV008 |
| TEXT |
Dashboard could not be viewed due to an error. |
| DESCRIPTION |
An internal error occurred while processing the loaded dashboard file. |
| SOLUTION |
Check the error log file(s) generated (see at the bottom of this page)
|
DV009
| CODE |
DV009 |
| TEXT |
The loaded file is not a valid dashboard file. |
| DESCRIPTION |
The loaded dashboard file may either be corrupted or invalid. |
| SOLUTION |
Ensure the file specified in the dashboard path is valid and has valid extension (*.SYDX) |
DV010
| CODE |
DV010 |
| TEXT |
The dashboard could not be viewed since we were unable to validate the current user authorization. |
| DESCRIPTION |
The user is trying to access the dashboard without logging into Alpana Server. |
| SOLUTION |
Ensure the user logged into Alpana Server. |
DV011
| CODE |
DV011 |
| TEXT |
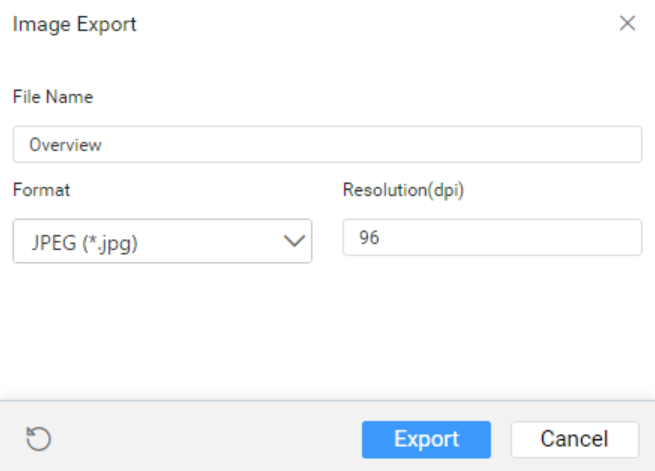
The exported image file could not be downloaded due to large file size. |
| DESCRIPTION |
The image resolution is higher than the system capacity. Large resolution leads to larger file size. |
| SOLUTION |
Recommended range for Image resolution is 96 to 300 dpi (dots per inch).
|