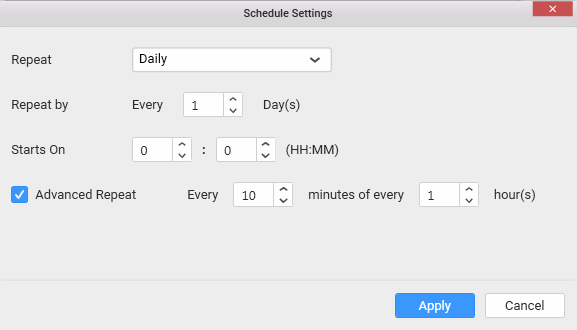
Manage Connections to Data Integration Tool
After published a live dashboard, learn how to manage connections to Data Integration Tool and how to Update a Schedule of a live dashboard.
Connect to Data Integration Tool via Dashboard Designer
To connect to Data Integration Tool via the Dashboard Designer:
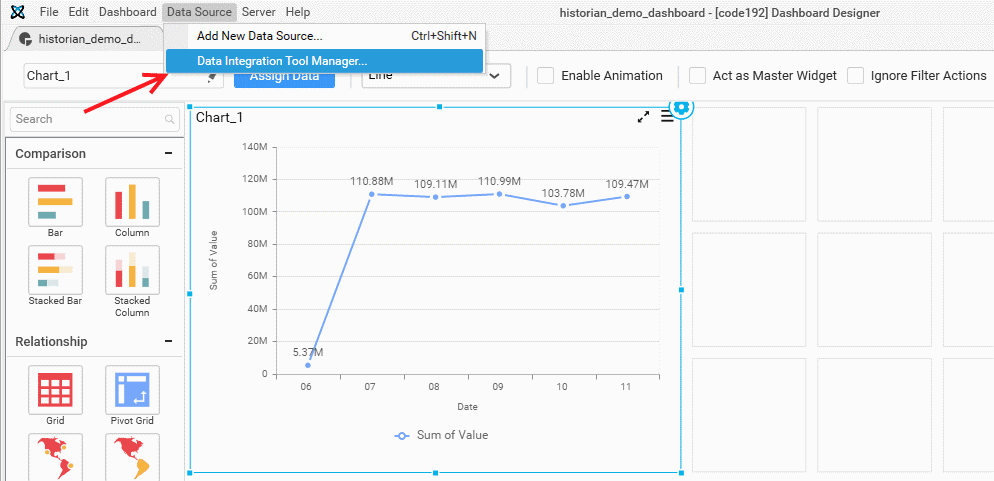
From the design Window, click Data source on the menu and click on Data Integration Tool Manager like below
The Code192 Data Integration Tool Connection window appears like below
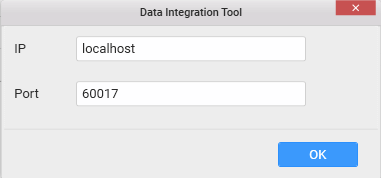
Set the IP address where Code192 Data Integration Tool is running.
Set the port to 60017(the Data Integration Tool default port)
Click OK.
Manage connections to Data Integration tool
The Data Integration Tool Manager window opens like below
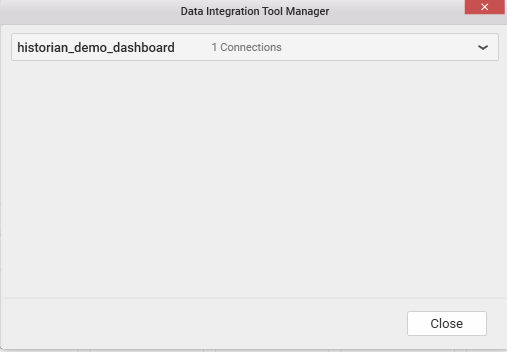
From here you can manage status connection, start or stop a connection and edit a Schedule.
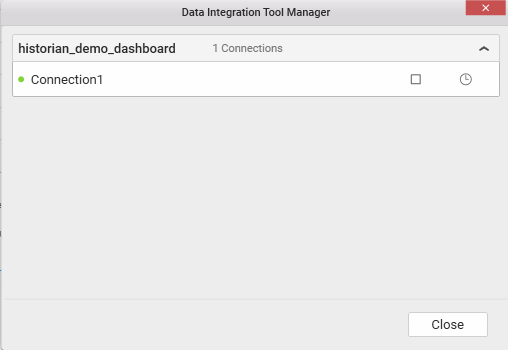
Check connection Status
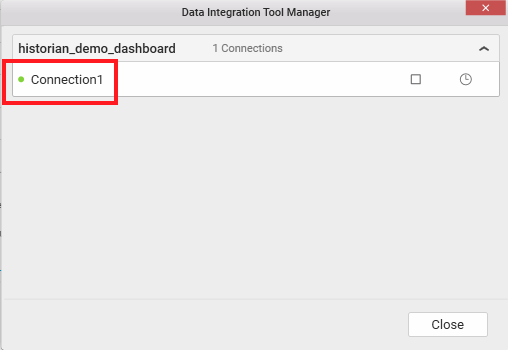
To check a connection status, select a connection by clicking on it via the Data Integration Tool Manager window like below
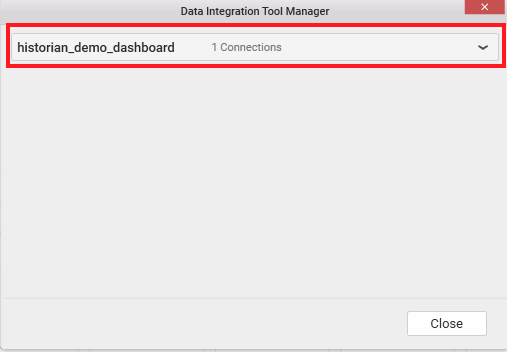
Then, the connection status appears like below
Start a connection
To start a connection, you can check the status of your connections from the Data Integration Tool Manager window like explained above.
If a connection status is stopped, it will be displayed like below
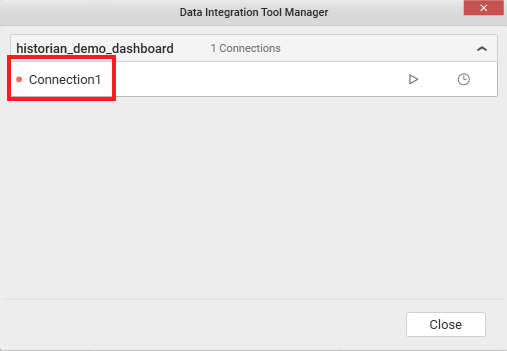
To start a stopped connection, click on the start button shown below
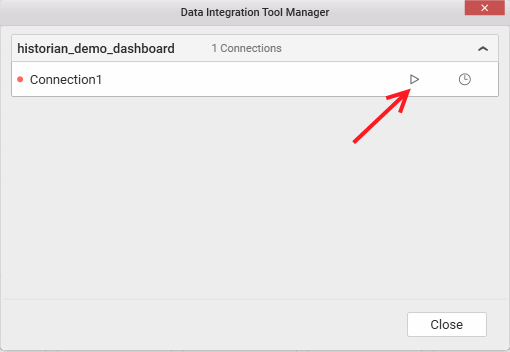
Then, the status will change from red to green like below
Stop a connection
To stop a connection, you can check the status of your connections from the Data Integration Tool Manager window like explained above.
If a connection status is started, it will be displayed like below

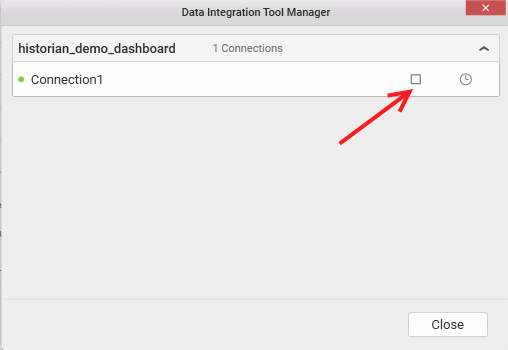
To stop a started connection, click on the stop button shown below
Then, the status will change from green to red like below

Edit Schedule of live dashboard
To Edit a Schedule of live Dashboard, you can check the status connection like explained above.
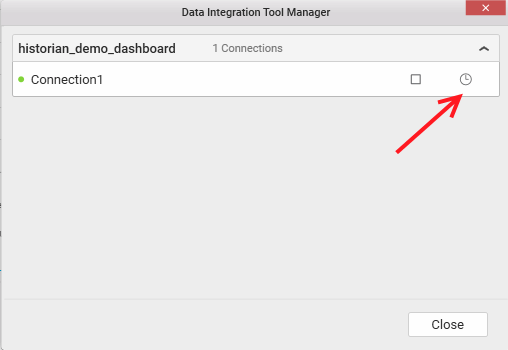
From the Data Integration Tool Manager window after selected your connection, click on the schedule icon like below
Then, the schedule settings window opens with your previous settings like below
